Welcome to Heterogeneity-Adjusted EWAS Explorer!
A fast, elegant portal for meta-analysis summaries across Beta, CHALM, and CAMDA methylation metrics—a Heterogeneity-Adjusted framework that recovers DNA methylation markers overlooked by conventional Beta-based EWAS.
- Interactive exploration: filter by Phenotype, Tissue, Type, and Method;
- Interactive exploration: search CpG/Gene/Location;
- Reproducible downloads: browse datasets with tags and sizes, then download matching CSVs.
Why Heterogeneity-Adjusted Methylation Metrics for Array-based EWAS?
Epigenome-wide association studies (EWAS) provide a scalable framework to map CpG-phenotype relationships in large populations. Despite limited genomic coverage, DNA methylation microarrays remain the workhorse for EWAS owing to their throughput and cost-effectiveness. However, conventional array quantification based on the Beta value—an averaged methylation metric—cannot capture methylation heterogeneity, limiting sensitivity to phenotype-associated signals and downstream discovery. Heterogeneity-adjusted methylation metrics such as CHALM (Cell Heterogeneity-Adjusted cLonal Methylation; Xu et al., Nat Commun, 2021) and CAMDA (Concurrence of Active Methylation and De-methylAtion; Shi et al., Nat Commun, 2021), originally defined on bisulfite-sequencing reads, capture clonal structure and concurrent methylation/demethylation dynamics, but are not directly available for array data.
To overcome this limitation, we develop a principled transformation that maps array-derived Beta measurements to heterogeneity-adjusted surrogates of CHALM and CAMDA, enabling heterogeneity-aware EWAS on microarrays. Leveraging this representation, we perform multi-cohort EWAS meta-analyses to increase statistical power and robustness. Across phenotypes and tissues, the approach consistently recovers DNA methylation markers underdetected by Beta-based analyses while reducing confounding from tissue composition, thereby advancing epigenome-wide discovery of phenotype-associated CpG sites and strengthening translational utility for biomarker discovery, risk stratification, and target nomination.
This website hosts curated summaries across phenotypes, tissues, and analytical types (Continuous, Binary, Survival), with harmonized effect estimates under Beta, CHALM, and CAMDA. Use Explore for rich interactive filtering and sorting, or head to Download for reproducible CSV exports matching your selections.
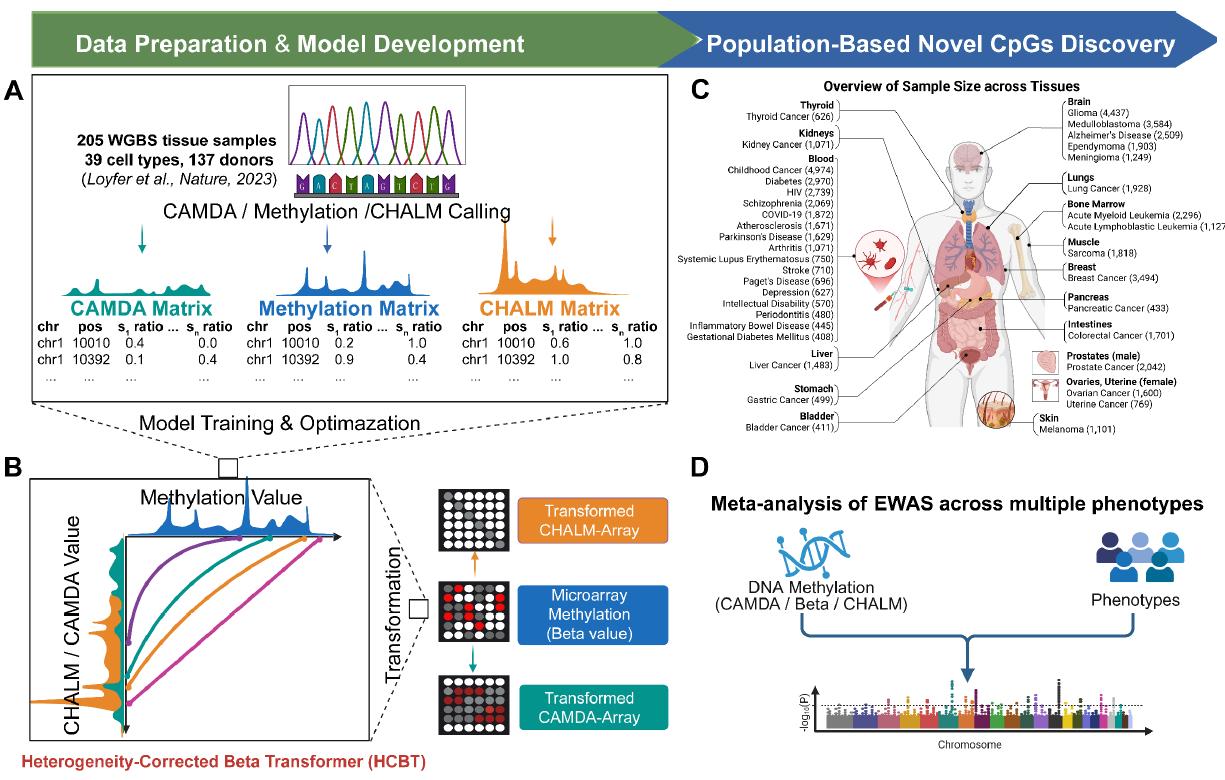
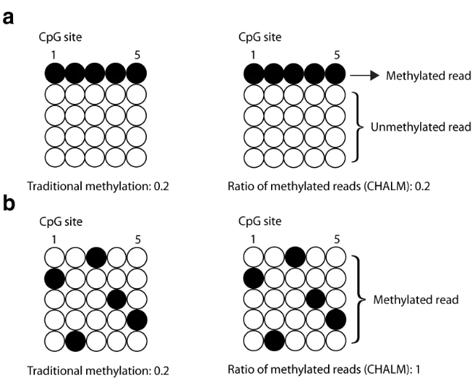
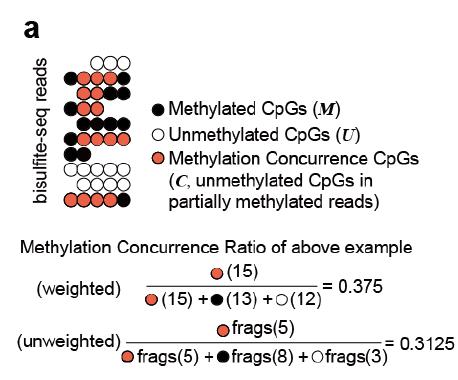
Note: CHALM quantifies the promoter methylation as the ratio of methylated reads (with ≥1 mCpG) to total reads mapped to a given promoter region. CAMDA quantifies the concurrence of active DNA methylation and demethylation within the same cell by dissecting reads from bisulfite sequencing.
Citation
Name, et al. Correcting methylation heterogeneity improves epigenome-wide discovery of phenotype-associated CpGs. Preprint/Journal, 2025. DOI: TBD.